A real example: turning $5,000 into $8,000
Say you invest $5,000 and sell three years later for $8,000. Your total ROI is:
($8,000 − $5,000) ÷ $5,000 = 60%
But that's spread over three years. The annualized return — the rate that matters for comparing investments — is about 17% per year. A 60% total return over 3 years is very different from 60% in a single year, which is why annualizing lets you compare deals of different lengths fairly. Enter your amounts and time frame above.
ROI vs annualized return — what's the difference?
Total ROI is the overall percentage gain: (final − initial) ÷ initial. It's simple, but it ignores time — a 50% return is very different over 1 year vs 10.
Annualized return (CAGR) fixes that by showing the smooth yearly rate that would turn your starting amount into the final value. It's the fairest way to compare investments held for different lengths of time.
The same ROI can be a great or a poor investment
Here is the calculator's default, $10,000 growing to $18,000 for an 80% total return, earned over four different lengths of time, alongside the classic "I doubled my money":
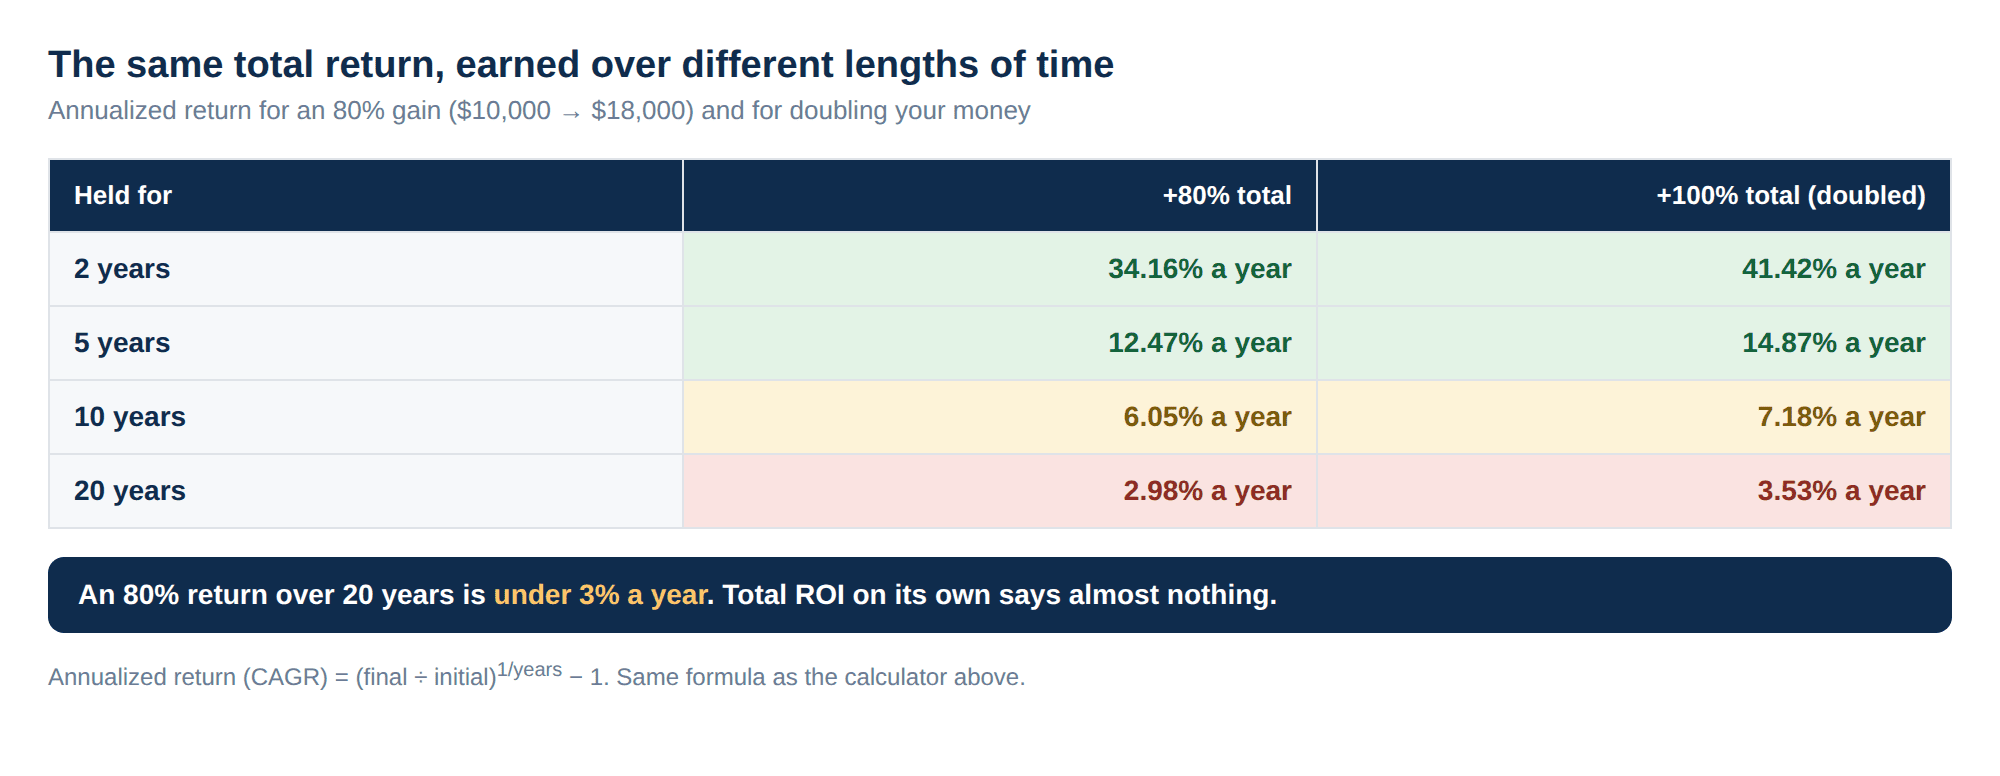
Stretch the same 80% from two years to twenty and the yearly return falls from 34.16% to 2.98%. Doubling your money sounds impressive, but over 20 years it works out to 3.53% a year. Whenever someone quotes a total return, the first question is always "over how long?"
Comparing two investments: total ROI picks the wrong winner
Total ROI is especially misleading when you rank investments held for different lengths of time. These four are illustrative, but the pattern is general:
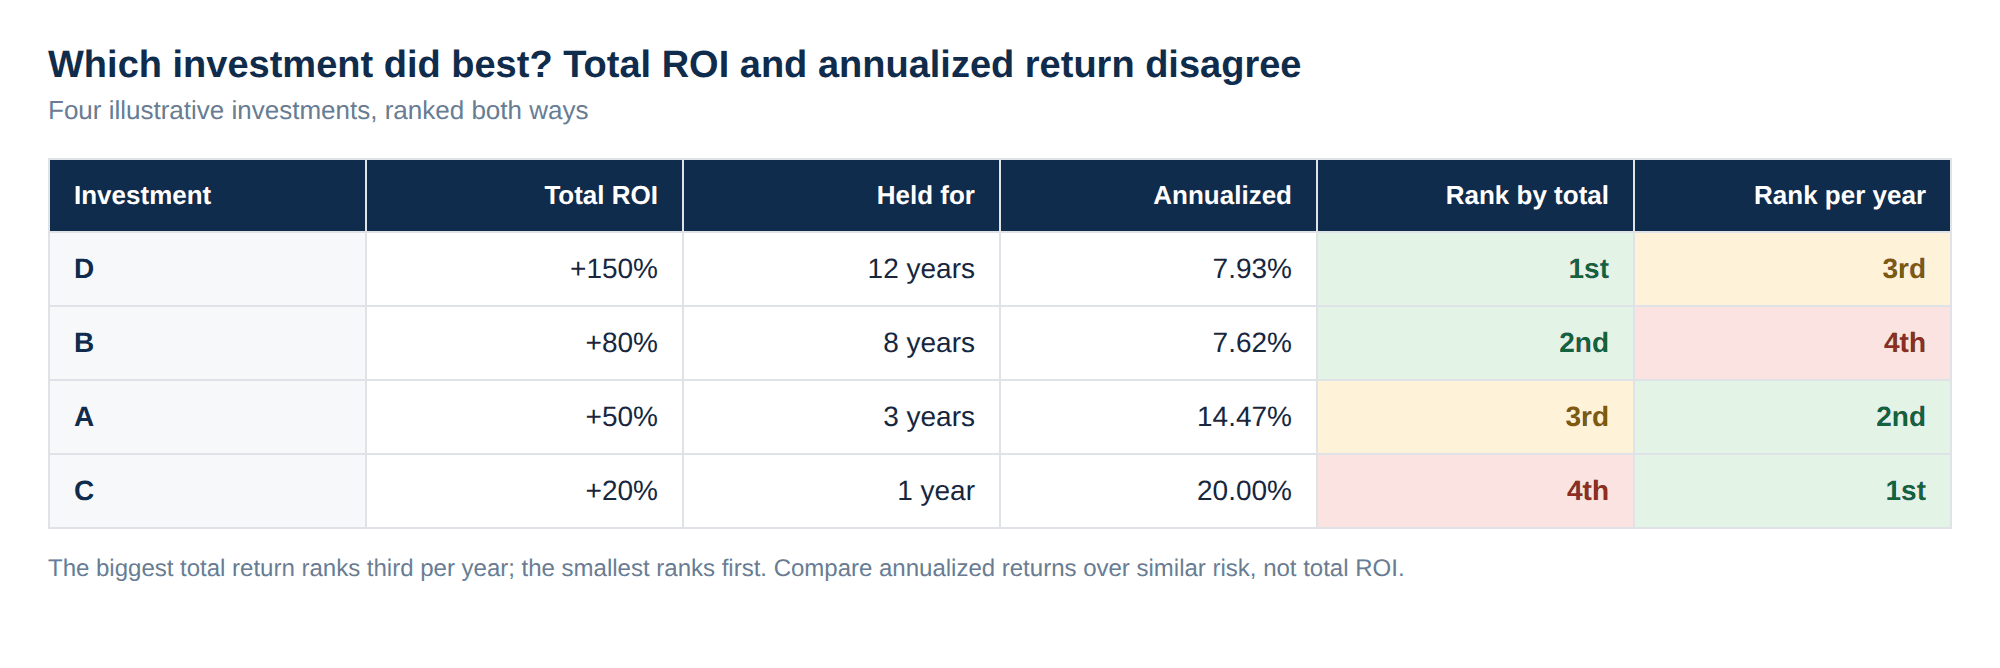
Ranked by total ROI, D wins. Ranked by what each one earned per year, it comes third, and the modest 20% gain comes first. That is why the calculator shows both numbers. Use the annualized figure when comparing, and compare investments with similar risk: a 20% year from a single volatile stock and a 7% year from a broad index fund are not the same achievement.
Putting it in context
A "good" annualized return depends on the risk. Broad stock markets have historically averaged roughly 7–10% per year over the long run. If your number is far above that, make sure you understand the risk you took; if it's below, compare against simply investing in low-cost index funds — see the compound interest calculator.
When ROI can mislead you
- It assumes one lump sum. If you added money or took some out along the way, a simple start-to-finish ROI overstates or understates your return. For regular contributions, use the compound interest calculator instead.
- Fees and taxes. Enter what you actually walked away with. If $10,000 became $18,000 over 5 years but $1,000 went on fees and taxes, your net is $17,000: 11.20% a year, not 12.47%.
- Income received along the way. Dividends, interest or rent paid out to you aren't in the final value unless you add them in. Leave them out and you understate the return.
- Inflation. The calculator shows a nominal return. With illustrative 3% inflation, a 12.47% nominal return is about 9.19% in real terms. The inflation calculator shows how much buying power the gain actually kept.
- Very short periods. Annualizing a short gain magnifies it. A 10% gain in six months annualizes to 21%, which assumes you could repeat it, and a lucky few months usually can't be.
- Borrowed money. With a mortgage or margin loan, ROI on the cash you put in can look far higher than the return on the asset itself, and losses are magnified the same way.
Grow your returns
Open a brokerage account
Low-cost index funds are how most people capture market returns.
Compare brokers →Compound Interest Calculator
See what your returns could become with regular investing.
Open calculator →TradingView
Charts, screeners and analysis tools to research your next investment — free plan available.
Try TradingView →Frequently asked questions
Does this account for extra contributions?
No — this measures a single lump sum from start to finish. For regular monthly investing, use the compound interest calculator.
Is this before or after tax?
It uses the values you enter. For after-tax ROI, enter your net proceeds after any taxes and fees.
What is the difference between ROI and annualized return?
ROI is the total percentage gain from start to finish. Annualized return, also called CAGR, is the steady yearly rate that would produce the same result. An 80% ROI is 12.47% a year over 5 years but 2.98% a year over 20, so annualized return is the one to compare.
How do I calculate annualized return?
Divide the final value by the initial value, raise the result to the power of 1 divided by the number of years, then subtract 1. For $10,000 growing to $18,000 over 5 years: 1.8 to the power of 0.2, minus 1, is 12.47% a year.
What is a good ROI?
It depends on how long the money was invested and how much risk you took. Compare annualized returns, not total ROI, and compare against a simple alternative over the same period, such as a low-cost index fund or a savings account.
Why does a short holding period give such a high annualized return?
Annualizing assumes the gain could be repeated every year. A 10% gain in six months annualizes to 21%. That is mathematically correct but rarely realistic, so treat annualized figures for periods under a year with caution.
Does the ROI calculator account for inflation?
No, it shows a nominal return. To estimate the real return, adjust for inflation over the same period. For example, a 12.47% nominal return with 3% inflation is about 9.19% a year in real terms.